




Sizing a common-disease market is largely an exercise in applying a known prevalence to a known population. Sizing a rare disease market is a different discipline entirely. The prevalence figure may come from a handful of old papers. The diagnosed population may be a small and shifting fraction of the true population. And the commercial opportunity depends heavily on how many patients are found at all, coded correctly when they are, and reachable through channels a small company can actually build.
A single sourced number is almost always wrong. A defensible estimate comes from triangulation, and from being explicit about which population you are counting. Here is how to build one.
Start With Rare Disease Prevalence Data, Then Distrust It
Published prevalence for rare diseases is often based on small studies, specific geographies, or diagnostic criteria that have since changed. Use it as one input, not as the answer.
When multiple prevalence estimates exist, the question worth asking is why they differ. Population studied, diagnostic definition, and publication year usually explain most of the spread. It is also worth knowing that there is no central, comprehensive repository of rare disease information. Knowledge bases are fragmented across separate databases with their own organizing principles, so both the number of recognized conditions and the population they affect shift depending on which source you consult.
The goal at this stage is a defensible range, not a false-precision point estimate. A range you can defend beats a number you cannot.
Separate the True, Diagnosed, and Treatable Populations
Three populations matter, and conflating them is the most common sizing error in rare disease.
True prevalence is everyone who has the disease, diagnosed or not.
Diagnosed prevalence is the subset correctly identified. In rare disease this can be a small fraction of the true population, because the path to a correct diagnosis is long and frequently runs through several specialists and at least one wrong answer first. NORD’s thirty-year analysis, comparing survey data from 1989 against a follow-up run in 2019, found that more than a quarter of US patients waited seven years or longer for a correct diagnosis, up from roughly 15 percent three decades earlier.
Treatable prevalence is smaller still: diagnosed, still in active care rather than lost to follow-up, reachable through the specialist channels you can realistically build, and eligible under the label you expect to receive.
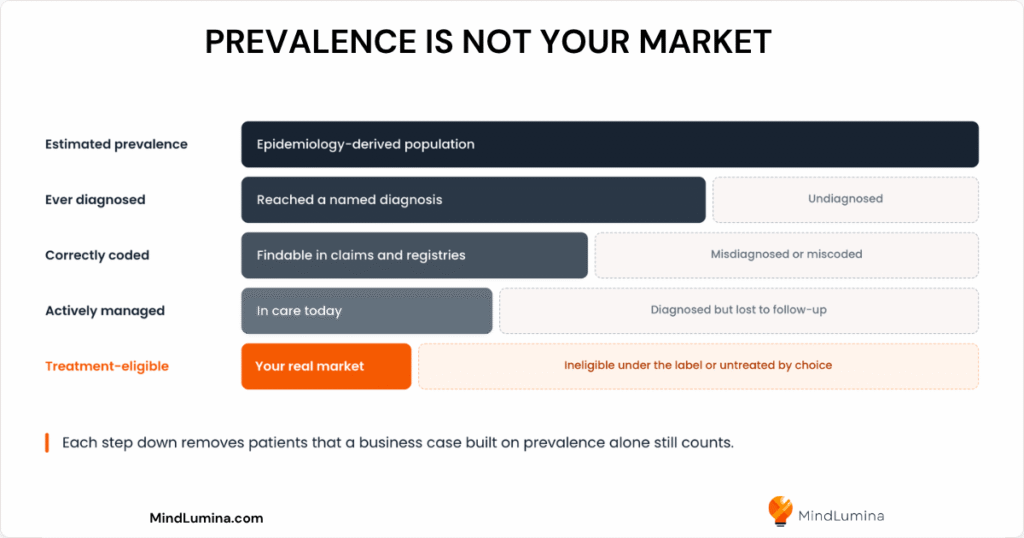
Commercial relevance lives closest to the third. Most forecasts quietly borrow the first. The gap between them is not a rounding error, and it is not fixed.
Triangulate Patient Counts Across Independent Data Sources
The core method is to build the estimate from several independent angles and see where they converge.
Claims and coding analysis. ICD codes tied to the condition, read with care. In the US, diagnoses are coded in ICD-10-CM, and the great majority of the roughly 7,000 recognized rare diseases have no unique code in it. Securing one takes years of advocacy: the Kabuki Syndrome Foundation campaigned for two years before its condition received a dedicated code. This is the gap ORPHAcodes and ICD-11 were built to close, and Orphanet remains the reference nomenclature most sizing work ultimately leans on. Treat claims as a floor on the diagnosed population, not a measurement of it.
Patient registries and advocacy data. Disease registries and patient organizations often hold the most grounded counts of the identified population, though they skew toward engaged and connected patients. NIH’s Genetic and Rare Diseases Information Center and NCATS registry guidance are useful starting points for locating what already exists in a given condition.
Treating physician estimates. Specialists who manage the condition can estimate their own patient counts. Aggregated across the specialist universe, this builds a bottom-up figure to compare against the top-down epidemiology.
Diagnostic and lab data. For conditions defined by a specific test, testing volumes and positivity rates can bound the diagnosed population independently of claims.
When these methods land in a similar range, confidence rises. When they diverge, the divergence itself is information, usually pointing at a diagnosis or coding gap worth understanding before it becomes a forecasting error.
What Rare Disease Market Sizing Looks Like in Practice
Consider a hypothetical inherited metabolic condition managed largely by pediatric specialists. The numbers below are illustrative rather than drawn from any specific disease.
Published prevalence suggests somewhere between 1 in 80,000 and 1 in 150,000, implying roughly 2,200 to 4,100 people in a population the size of the United States. That is the top-down anchor, and it is wide.
Claims analysis surfaces about 900 patients carrying a plausible code combination. The national registry lists roughly 1,100. Aggregating specialist estimates across the treating centers produces something closer to 1,400. Diagnostic testing volumes, adjusted for positivity, suggest 1,200 to 1,500 confirmed cases.
Three of those four methods cluster between 1,100 and 1,500, which is the diagnosed population. Claims sit lowest, consistent with the coding problem rather than contradicting the others. Against a true prevalence range starting at 2,200, the implication is that roughly half the patient population has not yet been identified.
That is not a disappointing finding. It is the most strategically useful output of the whole exercise, and it would have been invisible in a single-source estimate.
Model Diagnosis Rate Dynamics, Not Just the Snapshot
A rare disease population is not static. Newly diagnosed patients enter continuously, awareness efforts and new diagnostics accelerate identification, and in genetic or pediatric conditions the age structure shapes the treatable pool independently of prevalence.
A one-year snapshot can badly misrepresent a market that a screening advance is about to expand. Where diagnosis is the bottleneck rather than biology, model how the diagnosed fraction could change over the forecast period. That trajectory often matters more to the business case than the prevalence point estimate does, and unlike prevalence, it is something your own investment can move.
The same constraint shapes clinical development. A small diagnosed population is also the pool every trial must recruit from, which is why AI-driven patient identification matters disproportionately in rare disease programs.
Document Your Sizing Assumptions Like They Will Be Challenged
Because rare disease sizing rests on assumptions, the credibility of the estimate depends entirely on making them explicit: which prevalence range, what diagnosis rate, what treatable fraction, and the reasoning behind each.
A well-documented estimate with a stated range and clear logic survives scrutiny from investors, partners, and internal decision-makers. A confident single number with hidden assumptions does not survive the first hard question, and the credibility lost in that moment is difficult to recover.
Frequently Asked Questions (FAQs)
What is rare disease market sizing?
Rare disease market sizing is the process of estimating how many patients a therapy could reach when prevalence data is sparse and diagnosis rates are low. Unlike common-disease sizing, it cannot rely on applying a known prevalence to a known population, so it depends on triangulating several independent sources into a defensible range.
How do you size a rare disease market with limited data?
By triangulation: combining epidemiology, claims and coding analysis, patient registries, treating physician estimates, and diagnostic testing data into a range, then examining where the independent methods converge. Convergence builds confidence. Divergence usually reveals a coding or diagnosis gap worth investigating.
What is the difference between diagnosed and treatable prevalence?
Diagnosed prevalence is the population correctly identified as having the disease. Treatable prevalence is the smaller subset that is diagnosed, reachable, and eligible for therapy. In rare disease, both can sit far below true prevalence because of long diagnostic delays and incomplete coding.